Week 9 play of the week
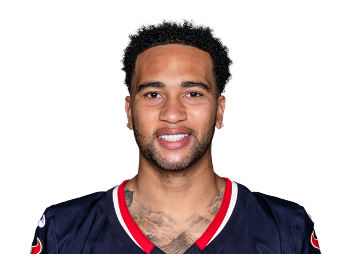

51.8UPS points · Eric Martel
At the desk: Stuart, Rich & Boomer · Kenny Mayne in the Coffee Shop
Eric Martel scored 328.3 in Week 9, the highest single-week score in league history (regular season, 2011–2026, 2,496 team-weeks). Week 9 recap, built from the league’s own data; an editor has not reviewed it.
Eric Martel scored 328.3 in Week 9, the highest single-week score in league history (regular season, 2011–2026, 2,496 team-weeks). The previous record was 325.5 by Steve Bousquet in Week 11 of 2021.
Scoring has risen across the eras, so here is the other measure. 328.3 was 158.9% of that week’s league average of 206.6, the third-best share on record. Ahead of it: Bear Dunn’s 295.4 in Week 12 of 2017 (176.4%, the best ever) and Steve Bousquet’s 325.5 in Week 11 of 2021 (168.5%).
Eric Martel won all three games: Chris Klingenberg by 150.9, Eric Mannila by 119.0, and Bear Dunn by 54.4.
| Highest single-week scores | Score | Share of average |
|---|---|---|
| 2026 · Eric Martel, Week 9 | 328.3 | 158.9% |
| 2021 · Steve Bousquet, Week 11 | 325.5 | 168.5% |
| 2025 · Eric Martel, Week 7 | 320.6 | 145.9% |
| 2026 · Eric Martel, Week 1 | 312.8 | 140.9% |
| 2022 · Steve Bousquet, Week 2 | 311.9 | 147.6% |
| Highest share of the league average | Score | Share of average |
|---|---|---|
| 2017 · Bear Dunn, Week 12 | 295.4 | 176.4% |
| 2021 · Steve Bousquet, Week 11 | 325.5 | 168.5% |
| 2026 · Eric Martel, Week 9 | 328.3 | 158.9% |
| 2013 · Shawn Blake, Week 13 | 264.1 | 157.6% |
| 2014 · Derrick Whitman, Week 13 | 251.4 | 153.3% |
Regular season only, 2011–2026 so far (2,496 team-weeks; playoff weeks are not counted). Share = a team’s score divided by that week’s league average, so eras can be compared. 2010 is left out because its archived weekly scores conflict with themselves.
The other story this week: Bear Dunn is on a historic pace.
Bear Dunn scored 273.9 in Week 9. Bear Dunn is 21–3 overall and 88–11 in All-Play.
Bear Dunn has beaten at least nine of the eleven other teams in each of the last 8 weeks; 3 of 2388 past team-weeks (2011–2025) reached a streak that long.
Here is what 88–11 means. Since 2011, 180 teams have reached Week 9 with a full record in the league archive. Exactly one had a better All-Play record at this point: Josh Martel’s 2018 team, which was 94–5.
That is .889 for Bear Dunn. Josh Martel’s 2018 start was .949. After Bear Dunn, the next best starts are Josh Martel’s 2021 team at 78–21 and Ryan Bousquet’s 2014 team at 76–23, then Bear Dunn’s 2020 team at 76–23.
And 2018 is the part worth sitting with. That team finished 25–1 with a 155–21 All-Play record, the best full season in the archive, and still lost the final. A great start is not a title.
Bear Dunn knows both ends of this. In 2021 the start was 25–74 in All-Play at this point. Now it is 88–11 with a 99.97% chance at the first-round bye and a 48.5% chance at the title in the forecast. The next best title odds belong to Eric Martel at 18.5%.
| Best All-Play starts through Week 9, 2011–2026 | Through Week 9 | Pct | How the season ended |
|---|---|---|---|
| 2018 · Josh Martel | 94–5 | .949 | Lost the final |
| 2026 · Bear Dunn | 88–11 | .889 | In progress |
| 2021 · Josh Martel | 78–21 | .788 | Third |
| 2014 · Ryan Bousquet | 76–23 | .768 | Champion |
| 2020 · Bear Dunn | 76–23 | .768 | Finished 5th |
All-Play counts every team’s weekly score against all eleven others, Weeks 1–9 of the regular season. Source: the league archive of weekly results, 2011–2025, plus the 2026 standings. 2010 is left out because its archived weekly scores conflict with themselves. The finish is the archive’s final standing.
In Legion of Boom, Shawn Blake is 78.6% to win the division and Derrick Whitman is 21.4%.
DOG POUND 4 LIFE v Outlast PG Time. Eric Martel is the sweep, and you know that part. The pain is on the other side. That makes Eric Martel 6–0 against the division.
Bear Dunn scored 273.9 and went 2–1: beat Brian Cross by 141.5, Brian Cutting by 49.3; lost to Eric Martel by 54.4.
Brian Cutting scored 224.6 and went 2–1: beat Chris Klingenberg by 47.2, Eric Mannila by 15.3; lost to Bear Dunn by 49.3.
Eric Mannila scored 209.3 and went 1–2: beat Brian Cross by 76.9; lost to Eric Martel by 119.0, Brian Cutting by 15.3.
Chris Klingenberg scored 177.4 and went 1–2: beat Brian Cross by 45.0; lost to Eric Martel by 150.9, Brian Cutting by 47.2. Chris Klingenberg is 14–10 overall but 1–5 against the division. Everything won has been won somewhere else.
Brian Cross scored 132.4 and went 0–3: lost to Bear Dunn by 141.5, Eric Mannila by 76.9, Chris Klingenberg by 45.0. That was the lowest score of the week. Brian Cross is 0–6 inside the division and <0.01% to make the playoffs.
Brian Cutting and Chris Klingenberg are both 14–10, and the division is Cutting’s at 4.4% to Klingenberg’s 0.02%.
LEGION OF BOOM v Maddie Mondays. Keith Creelman scored 263.5 and went 3–0: beat Matt Gerardi by 128.7, Derrick Whitman by 76.9, Shawn Blake by 64.0.
Shawn Blake scored 199.5 and went 2–1: beat Josh Martel by 27.9, Ryan Bousquet by 22.6; lost to Keith Creelman by 64.0.
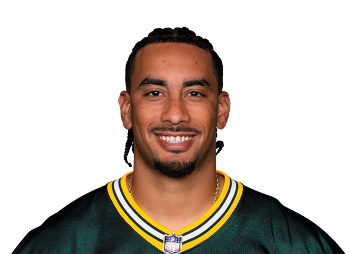
Derrick Whitman scored 186.6, with 43.7 from Jordan Love, and went 2–1: beat Josh Martel by 15.0, Ryan Bousquet by 9.7, the closest game of the week; lost to Keith Creelman by 76.9.
Ryan Bousquet scored 176.9 and went 1–2: beat Matt Gerardi by 42.1; lost to Shawn Blake by 22.6, Derrick Whitman by 9.7.
Josh Martel scored 171.6 and went 1–2: beat Matt Gerardi by 36.8; lost to Shawn Blake by 27.9, Derrick Whitman by 15.0.
Matt Gerardi scored 134.8 and went 0–3: lost to Keith Creelman by 128.7, Ryan Bousquet by 42.1, Josh Martel by 36.8. The best possible lineup, 191.0, would have won a game.
Keith Creelman and Shawn Blake are both 13–11, and the division is Creelman’s at 93.1% to Blake’s 78.6%.
site/wire/data/kenny_picks_2026_wk09.json ({"picks": [{"id": "...", "frame": true, "note": "joke, no digits"}]}); the job then weaves each into its division’s chapter with the link and removes this box. 1 message(s) ruled out by an editor or touching family, health or similar were withheld and must not be used. 47 candidate line(s) are listed, verbatim, linked and grouped by division, in the local review copy only (raw chat stays off the public repo).| Division | Swept | Split | Shut out |
|---|---|---|---|
| DOG POUND 4 LIFE v Outlast PG Time | Eric Martel 328.3 | Bear Dunn 273.9, Brian Cutting 224.6, Eric Mannila 209.3, Chris Klingenberg 177.4 | Brian Cross 132.4 |
| LEGION OF BOOM v Maddie Mondays | Keith Creelman 263.5 | Shawn Blake 199.5, Derrick Whitman 186.6, Ryan Bousquet 176.9, Josh Martel 171.6 | Matt Gerardi 134.8 |
Week 9 scores. A team is Swept when it won every game it played in the group, Shut out when it won none and Split otherwise. History lines use the league archive of weekly results (2010 is left out because its archived scores conflict with themselves). Chat lines are owner posts in the league Discord, linked to the message.
Here is the shape of it. Four division leaders: Bear Dunn at 99.98% to win Dog Pound 4 Life, Eric Martel at 95.6%, Keith Creelman at 93.1%, and Shawn Blake at 78.6%. Shawn Blake’s is the soft one, with Derrick Whitman at 21.4% sharing the rest.
Then the wild-card road. Brian Cutting is 97.1% to make the playoffs with only a 4.4% chance of winning the division, so Cutting gets in the other way. Chris Klingenberg is 51.4% with a 0.02% division chance, and Klingenberg is counting entirely on a wild card. Derrick Whitman is 43.8% and Mannila 15.2%.
And the bottom: Ryan Bousquet is at 6.3%, Josh Martel at 0.6%, Matt Gerardi at <0.01%, and Brian Cross at <0.01%.
| Franchise | Playoffs | First-round bye | Wins division | Title |
|---|---|---|---|---|
 Bear Dunn | 99.99% | 99.97% | 99.98% | 48.5% |
| Eric Martel | 99.97% | 93.2% | 95.6% | 18.5% |
 Brian Cutting | 97.1% | 4.1% | 4.4% | 18.1% |
 Keith Creelman | 93.2% | 0.04% | 93.1% | 3.0% |
 Shawn Blake | 92.4% | 2.6% | 78.6% | 8.6% |
 Chris Klingenberg | 51.4% | 0.01% | 0.02% | 1.3% |
 Derrick Whitman | 43.8% | 0.04% | 21.4% | 1.3% |
 Eric Mannila | 15.2% | <0.01% | <0.01% | 0.6% |
 Ryan Bousquet | 6.3% | <0.01% | 6.3% | 0.1% |
 Josh Martel | 0.6% | <0.01% | 0.6% | <0.01% |
 Matt Gerardi | <0.01% | <0.01% | <0.01% | <0.01% |
 Brian Cross | <0.01% | <0.01% | <0.01% | <0.01% |
Probabilities updated after Week 9 (Tue Nov 10, 10:02 AM ET), 10,000 simulated seasons. One team wins each division in every simulated season; division odds and the league’s title odds are rounded so each group still adds up to the whole. A probability prints as certain only when the outcome is clinched or eliminated; a figure that would round to certain prints to two decimals, or as <0.01%.
Start with the number nobody had. C.J. Stroud was projected for 15.3 and scored 51.8 for Eric Martel: 21-of-35 for 384 yards, five touchdowns and one interception. That is +36.5, the biggest bargain of the week. Nick Cross added 23.4 against a 9.1 projection.
Jordan Love was projected for 15.8 and scored 43.7 for Derrick Whitman, another big bargain. Matthew Golden, Matt Gerardi’s receiver, was projected for 12.4 and put up 36.8. CeeDee Lamb, Eric Mannila’s receiver, was projected for 13.8 and put up 37.3.
Now the other side. Matt Gerardi started Malik Willis and Ty'Ron Hopper, projected for 15.2 and 8.0, and got 2.9 and 0.0 from them. That is 20.3 projected points that never showed up, and Matt Gerardi still scored 134.8 and went 0–3.
Eric Martel’s Josh Jacobs went from 14.9 projected to 0.5, and Eric Martel still scored 328.3.
On defense, Arvell Reese gave Eric Mannila 26.5 on a 6.4 projection.
 Jaxon Smith-Njigba (WR, Bear Dunn)10 targets, 61 air yards · MFL proj. Sun 2:17 PM ET · kickoff Sun 4:25 PM ET28.4 → 12.5-15.9Josh Jacobs (RB, Eric Martel)4 carries · MFL proj. Sun 2:17 PM ET · kickoff Sun 4:25 PM ET14.9 → 0.5-14.4Malik Willis (QB, Matt Gerardi)25 passes, 230 air yards, 2 carries · MFL proj. Sun 11:57 AM ET · kickoff Sun 1:00 PM ET15.2 → 2.9-12.3Jared Goff (QB, Chris Klingenberg)25 passes, 148 air yards, 4 carries · MFL proj. Sun 11:57 AM ET · kickoff Sun 1:00 PM ET17.0 → 5.6-11.4Jonathan Taylor (RB, Derrick Whitman)13 carries, 5 targets · MFL proj. Sun 11:57 AM ET · kickoff Sun 1:00 PM ET20.2 → 8.8-11.4C.J. Stroud (QB, Eric Martel)35 passes, 418 air yards, 2 carries · MFL proj. Sun 2:17 PM ET · kickoff Sun 4:05 PM ET15.3 → 51.8+36.5Jordan Love (QB, Derrick Whitman)29 passes, 384 air yards, 1 carry · MFL proj. Sun 2:17 PM ET · kickoff Sun 4:25 PM ET15.8 → 43.7+27.9Matthew Golden (WR, Matt Gerardi)10 targets, 120 air yards · MFL proj. Sun 2:17 PM ET · kickoff Sun 4:25 PM ET12.4 → 36.8+24.4CeeDee Lamb (WR, Eric Mannila)16 targets, 250 air yards · MFL proj. Sun 11:57 AM ET · kickoff Sun 1:00 PM ET13.8 → 37.3+23.5Joe Burrow (QB, Bear Dunn)29 passes, 189 air yards, 3 carries · MFL proj. Fri 2:14 PM ET · kickoff Sun 9:30 AM ET16.3 → 38.1+21.8Ty'Ron Hopper (LB, Matt Gerardi)MFL proj. Sun 2:17 PM ET · kickoff Sun 4:25 PM ET8.0 → 0.0-8.0Tuli Tuipulotu (DL, Josh Martel)MFL proj. Sun 2:17 PM ET · kickoff Sun 4:05 PM ET8.1 → 1.0-7.1Harrison Smith (DB, Derrick Whitman)MFL proj. Sun 2:17 PM ET · kickoff Mon 8:15 PM ET8.5 → 2.6-5.9Aaron Donald (DL, Matt Gerardi)MFL proj. Sun 11:57 AM ET · kickoff Sun 1:00 PM ET5.5 → 0.5-5.0Drake Thomas (LB, Derrick Whitman)MFL proj. Sun 2:17 PM ET · kickoff Sun 4:25 PM ET7.3 → 2.5-4.8Arvell Reese (LB, Eric Mannila)MFL proj. Sun 11:57 AM ET · kickoff Sun 1:00 PM ET6.4 → 26.5+20.1Myles Garrett (DL, Brian Cutting)MFL proj. Sun 11:57 AM ET · kickoff Sun 1:00 PM ET4.4 → 21.5+17.1Carson Schwesinger (LB, Josh Martel)MFL proj. Sun 11:57 AM ET · kickoff Sun 1:00 PM ET7.1 → 23.5+16.4Nick Cross (DB, Eric Martel)MFL proj. Sun 11:57 AM ET · kickoff Sun 1:00 PM ET9.1 → 23.4+14.3George Karlaftis (DL, Chris Klingenberg)MFL proj. Sun 11:57 AM ET · kickoff Sun 1:00 PM ET6.3 → 20.5+14.2
Started players only. Projection source: each player’s last MFL projection saved before his own kickoff, captured Thu Nov 5, 7:44 PM ET, Fri Nov 6, 2:14 PM ET, Sun Nov 8, 11:57 AM ET and later; every row shows its capture time and the player’s own kickoff, and every capture came first. 185 offensive and defensive starters graded; 1 not graded for want of a pregame capture. Largest gaps among graded starters, not every starter.
Treat the last three weeks as their own season. In Weeks 7–9, Bear Dunn is 32–1 in All-Play and Eric Martel is 31–2. Those are the only two Dominant teams in the league. The next best are Brian Cutting at 21–12 and Chris Klingenberg at 21–12.
The movers. Josh Martel climbed from twelfth in scoring in Weeks 1–6 to eighth in Weeks 7–9. Chris Klingenberg climbed from eighth in scoring in Weeks 1–6 to fifth in Weeks 7–9. Shawn Blake fell from second to seventh and is 15–18 over the stretch. Derrick Whitman went from fifth to tenth, and Cross from ninth to twelfth.
Then ask what history says about where everyone sits after Week 9. The Survival Line looks at past seasons: of teams with Bear Dunn’s All-Play rank at this point, 16 of 18 made the playoffs; Eric Martel’s group, 16 of 18; Brian Cutting’s group, 18 of 19; Keith Creelman’s group, 4 of 20.
At the bottom, Brian Cross is 1 of 17 by All-Play rank and 0 of 5 by wins, and Matt Gerardi is 3 of 17 and 0 of 5. Their odds are <0.01% and <0.01%. Josh Martel is 3 of 17 and 4 of 20, and 0.6%.
And luck. Josh Martel is +1.8 wins over what the All-Play rate predicts, the most in the league, and Shawn Blake is −1.6, the fewest. Brian Cutting leaves 40.6 points on the bench every week, also the most, and 5 of 10 losses would have been wins with the best lineup.
| Franchise | Division | Record | Week 9 all-play | All-play | Points for |
|---|---|---|---|---|---|
| Bear Dunn | leader | 21–3 | 10–1 | 88–11 | 2,423.1 |
| Eric Martel | leader | 19–5 | 11–0 | 77–22 | 2,254.4 |
| Brian Cutting | 14–10 | 8–3 | 60–39 | 2,028.4 | |
| Shawn Blake | leader | 13–11 | 6–5 | 59–40 | 2,023.8 |
| Chris Klingenberg | 14–10 | 4–7 | 55–44 | 1,851.8 | |
| Keith Creelman | leader | 13–11 | 9–2 | 50–49 | 1,958.4 |
| Derrick Whitman | 13–11 | 5–6 | 54–45 | 1,916.3 | |
| Eric Mannila | 12–12 | 7–4 | 48–51 | 1,867.9 | |
| Ryan Bousquet | 9–15 | 3–8 | 33–66 | 1,722.5 | |
| Josh Martel | 7–17 | 2–9 | 24–75 | 1,644.4 | |
| Matt Gerardi | 4–20 | 1–10 | 24–75 | 1,619.0 | |
| Brian Cross | 5–19 | 0–11 | 22–77 | 1,651.6 |
In the same order as the league standings page: the current playoff field first (division leaders take the top two places), then everyone else; every place goes by all-play percentage, then overall record, then points for, then head-to-head.
| Week 9 matchup | Our favorite | Final | Called it? |
|---|---|---|---|
| Bear Dunn vs Brian Cross | Bear Dunn (87%) | 273.9–132.4 | yes |
| Bear Dunn vs Eric Martel | Bear Dunn (67%) | 273.9–328.3 | no |
| Bear Dunn vs Brian Cutting | Bear Dunn (67%) | 273.9–224.6 | yes |
| Shawn Blake vs Ryan Bousquet | Shawn Blake (67%) | 199.5–176.9 | yes |
| Shawn Blake vs Josh Martel | Shawn Blake (66%) | 199.5–171.6 | yes |
| Keith Creelman vs Matt Gerardi | Keith Creelman (65%) | 263.5–134.8 | yes |
| Eric Mannila vs Brian Cross | Eric Mannila (64%) | 209.3–132.4 | yes |
| Chris Klingenberg vs Brian Cross | Chris Klingenberg (64%) | 177.4–132.4 | yes |
| Brian Cutting vs Chris Klingenberg | Brian Cutting (63%) | 224.6–177.4 | yes |
| Eric Martel vs Chris Klingenberg | Eric Martel (63%) | 328.3–177.4 | yes |
| Brian Cutting vs Eric Mannila | Brian Cutting (62%) | 224.6–209.3 | yes |
| Eric Martel vs Eric Mannila | Eric Martel (62%) | 328.3–209.3 | yes |
| Derrick Whitman vs Ryan Bousquet | Derrick Whitman (59%) | 186.6–176.9 | yes |
| Derrick Whitman vs Josh Martel | Derrick Whitman (58%) | 186.6–171.6 | yes |
| Keith Creelman vs Derrick Whitman | Keith Creelman (55%) | 263.5–186.6 | yes |
| Shawn Blake vs Keith Creelman | Shawn Blake (52%) | 199.5–263.5 | no |
| Ryan Bousquet vs Matt Gerardi | Ryan Bousquet (51%) | 176.9–134.8 | yes |
| Josh Martel vs Matt Gerardi | Josh Martel (51%) | 171.6–134.8 | yes |
Last week’s published preview, graded against the final scores: favorites won 16 of 18.
| Team Reading | All-Play Wks 7–9 (season) | Scoring rank Wks 1–6 → Wks 7–9 |
|---|---|---|
| Bear Dunn Dominant | 32–1 (88–11) | 1st → 1st |
| Eric Martel Dominant | 31–2 (77–22) | 3rd → 2nd |
| Brian Cutting Holding | 21–12 (60–39) | 4th → 3rd |
| Chris Klingenberg Holding | 21–12 (55–44) | 8th → 5th |
| Eric Mannila Holding | 19–14 (48–51) | 7th → 6th |
| Keith Creelman Holding | 17–16 (50–49) | 6th → 4th |
| Shawn Blake Cooling | 15–18 (59–40) | 2nd → 7th |
| Josh Martel Rising | 13–20 (24–75) | 12th → 8th |
| Derrick Whitman Cooling | 12–21 (54–45) | 5th → 10th |
| Ryan Bousquet Holding | 10–23 (33–66) | 10th → 9th |
| Matt Gerardi Holding | 6–27 (24–75) | 11th → 11th |
| Brian Cross Sinking | 1–32 (22–77) | 9th → 12th |
Sorted by All-Play over Weeks 7–9; the full-season All-Play record is in parentheses. Reading, applied in order: Dominant = at least 28 of every 33 all-play games in that stretch; Sinking = 5 of every 33 or fewer; Rising / Cooling = scoring rank moved four or more places; otherwise Holding.
| Team | Left on bench / wk | Losses the best lineup would have won | Wins vs expected |
|---|---|---|---|
| Brian Cutting | 40.6 | 5 of 10 | −0.7 |
| Eric Martel | 33.0 | 3 of 5 | +0.6 |
| Chris Klingenberg | 30.7 | 2 of 10 | +0.5 |
| Matt Gerardi | 29.4 | 8 of 20 | −1.4 |
| Eric Mannila | 28.4 | 6 of 12 | +1.0 |
| Derrick Whitman | 26.6 | 5 of 11 | −0.5 |
| Keith Creelman | 26.5 | 5 of 11 | +0.5 |
| Ryan Bousquet | 26.3 | 6 of 15 | +1.2 |
| Shawn Blake | 25.8 | 5 of 11 | −1.6 |
| Josh Martel | 24.5 | 6 of 17 | +1.8 |
| Bear Dunn | 21.2 | 2 of 3 | −0.8 |
| Brian Cross | 20.1 | 4 of 19 | −0.5 |
Bench points = the best possible lineup from the same roster, known only after the games, minus the lineup started. Wins vs expected = head-to-head wins minus the wins each week’s all-play rate would give.
| Team | Category, playoffs | Made it from the same All-Play rank, 2017–2025 | Made it with the same win total, 2021–2025 |
|---|---|---|---|
| Bear Dunn | Contender 99.99% | 16/18 | 8/8 |
| Eric Martel | Contender 99.97% | 16/18 | 8/8 |
| Brian Cutting | Contender 97.1% | 18/19 | 9/16 |
| Keith Creelman | Contender 93.2% | 4/20 | 9/16 |
| Shawn Blake | Contender 92.4% | 18/19 | 9/16 |
| Chris Klingenberg | In the race 51.4% | 12/17 | 9/16 |
| Derrick Whitman | In the race 43.8% | 12/17 | 9/16 |
| Eric Mannila | Needs a run 15.2% | 4/20 | 9/16 |
| Ryan Bousquet | Life support 6.3% | 3/17 | 4/20 |
| Josh Martel | Life support 0.6% | 3/17 | 4/20 |
| Matt Gerardi | Life support <0.01% | 3/17 | 0/5 |
| Brian Cross | Life support <0.01% | 1/17 | 0/5 |
“Made it”: teams in the same position after Week 9 of a past season who went on to make the playoffs, out of all such teams. All-Play rank is grouped in pairs (tied teams share the higher rank); win totals are grouped in five bands, among seasons with the same number of games so far. Categories come from this week’s playoff odds: Contender 90% or better, In the field 60–90, In the race 25–60, Needs a run 8–25, Life support under 8.